Florida Flooding
 |
| The Purple shading is the flooding depth with the darker purple indicating deeper water. The various shades of grey indicate the population density with dark grey meaning very populated. |
California Oxford Tsunami Flood Map
(In green and red.....tis the season!)
 |
| The red dots are facilities that would be affected by a tsunami. The blue area is the flooded area. |
3D Map of Eau Claire
 |
| This is a 3D map of Eau Claire. From this map you can see the different elevations the buildings are at and where the river is. |
Other Flood Maps of Eau Claire
 |
| This is a flood map of Eau Claire with a water level of 800 feet. |
 |
| This is a flood map of Eau Claire with a water level at 790 feet. |
100 Year Flood in Eau Claire!
This is a map of the Eau Claire campus. The green part of the map is where the flooding would take place. The campus buildings are peach colored. This map has a flood line of 780 ft which is what FEMA reports as a 100 year flood in Eau Claire.
GIS Map of Forest Falls
This map shows the volume of water in the area and the steep sloped ares. It shows that the houses in the area were in a bad location.
GIS Map of Slope
This is a map of the slope and hillshade elevation. The ligher areas are at a steeper slope and the red areas are at a higher elevation.
GIS Map of Areas That Are Susceptible To Landslides
This is a map of 5 areas in the US that tend to get landslides. The text boxes explain why these areas are susceptible.
Volume of Mt. St.Helens Lost
The red areas are the areas that lost volume after the eruption
Mt. St.Helens After Eruption
Mt. St.Helens Before Eruption
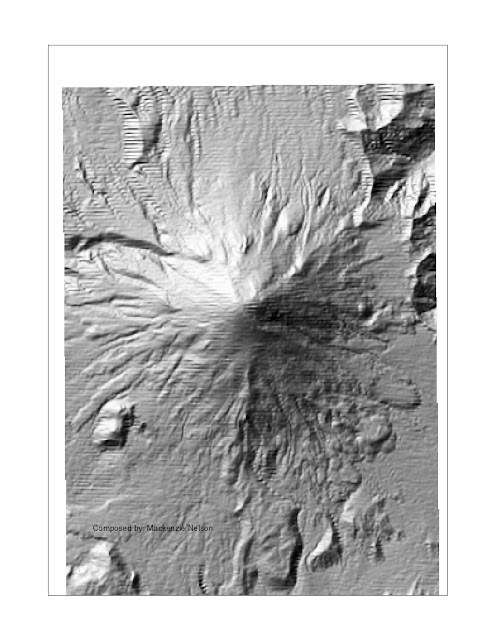
3D Map of Mt. Rainer using TIN
Boring 3D Map of Mt. Rainer
Volcanoes

This is map shows the top five countries that have the most volcanoes, the tectonic plate boundaries and the direction that the boundaries are moving.
Map of Earthquake Related Factors
This map shows the urban areas that are at risk of being hit by an Earthquake. The blue areas that don't change shade represent Q type of rock that is very suseptible to shaking. the other colored areas are the probablity of that area shaking. The red and yellow areas have the highest probablity.


No comments:
Post a Comment